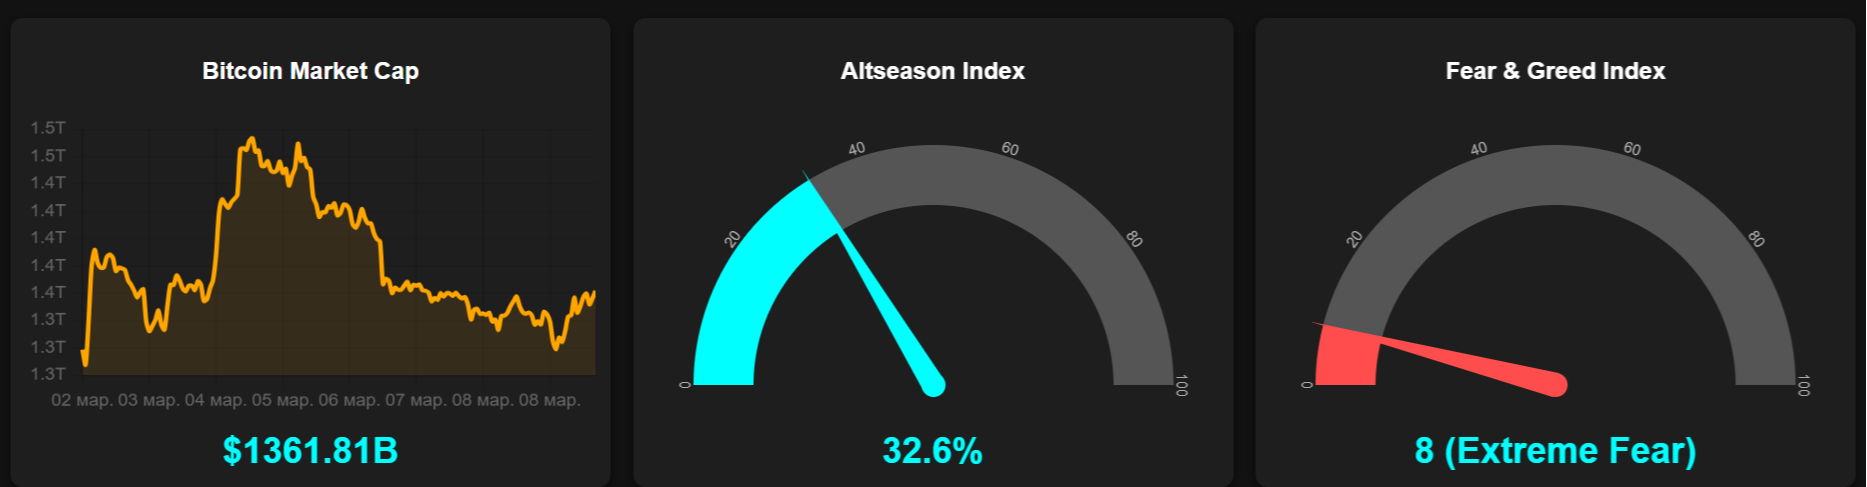
Bitcoin Market Cap - BTC market capitalization trend (chart + current value)
Altseason Index - the altseason index expressed as a percentage
Fear & Greed Index - the market sentiment index (numeric value + classification)
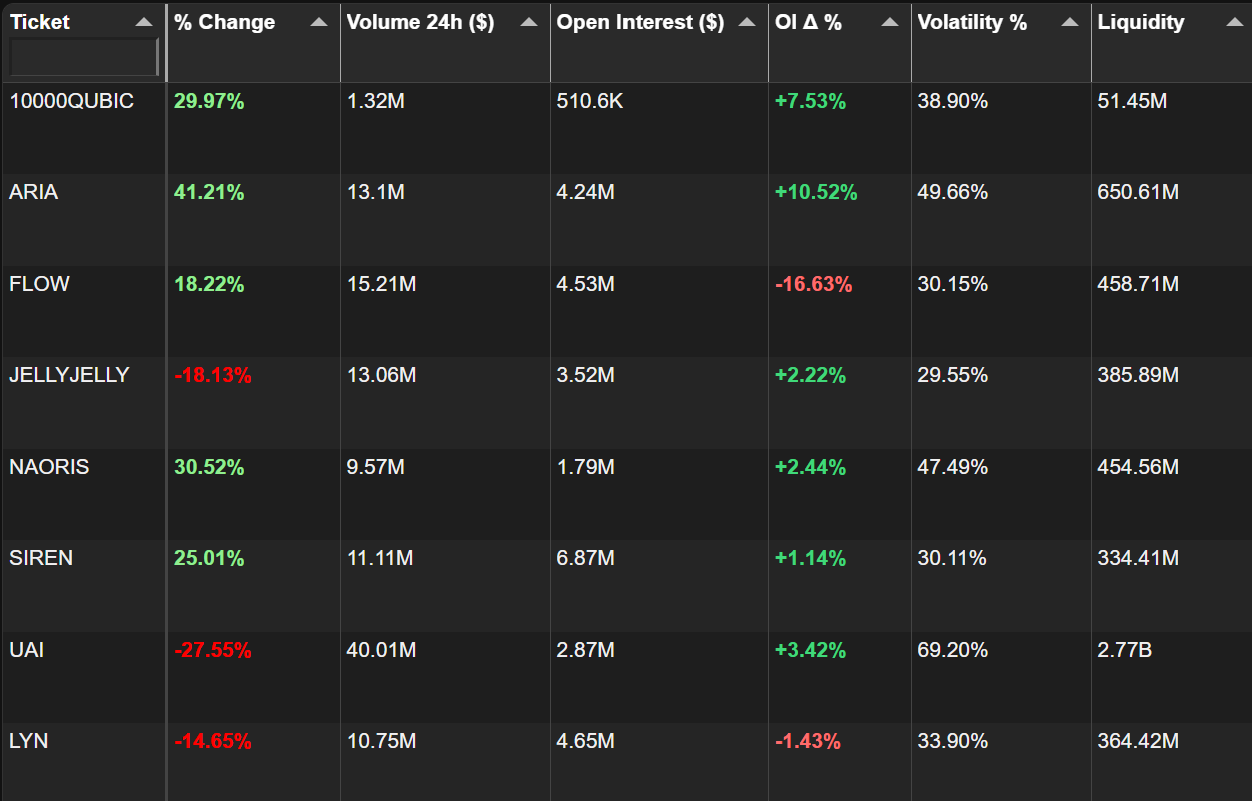
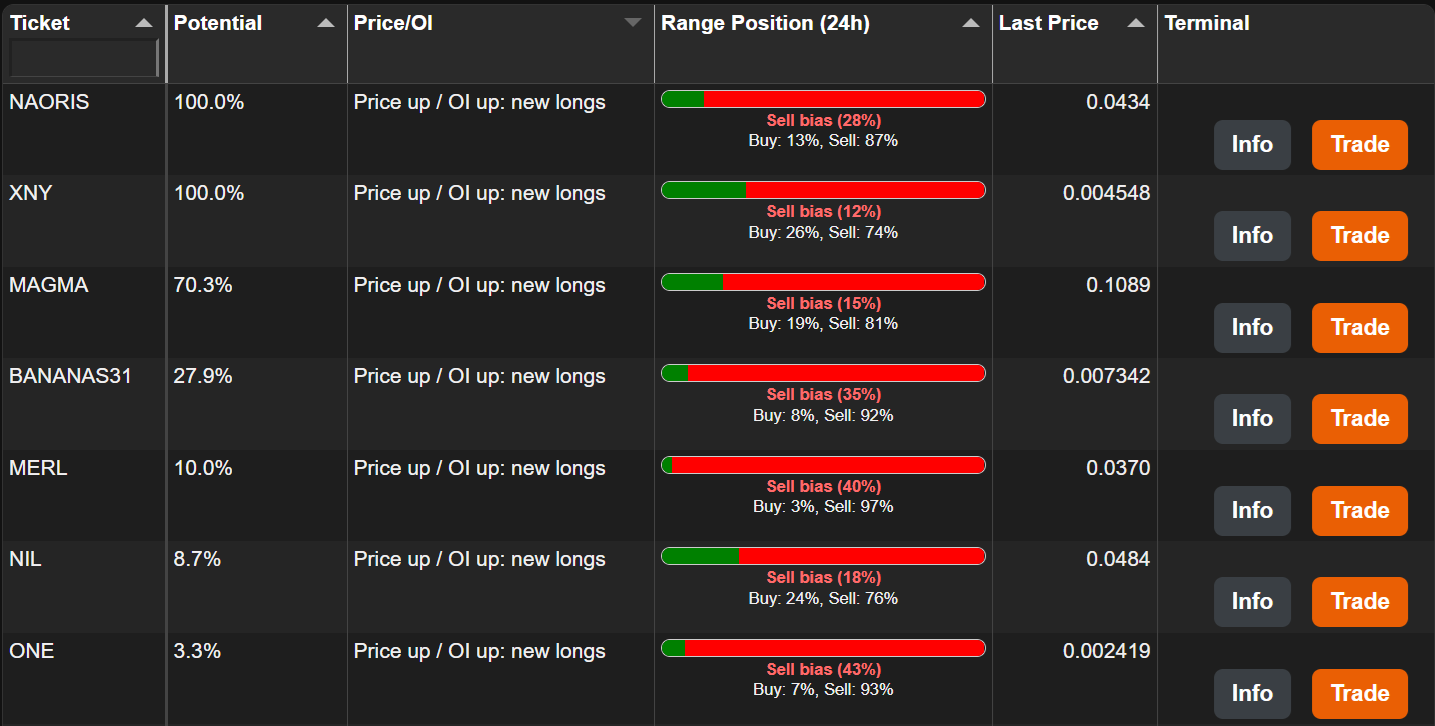
Ticket - the coin ticker (for example, BTC or ETH)
% Change - price change over the last 24 hours
Volume 24h ($) - 24-hour trading volume in dollar terms
Open Interest ($) - the dollar value of open interest in futures
OI D % - the percentage change in open interest (open interest delta)
Volatility % - 24-hour volatility, showing how wide the price range has been
Liquidity - estimated liquidity, a derived metric based on volume and volatility
Potential - a potential rating calculated using the formula selected in Settings
Price/OI - иinterpretation of the relationship between price and open interest:
Price up / OI up = inflow of new longs
Price down / OI up = inflow of new shorts
Price up / OI down = short squeeze
Price down / OI down = long squeeze
Range Position (24h) - the price position within the daily range (buy/sell bias + confidence)
Last Price - the latest price
Actions - nfo and Trade buttons
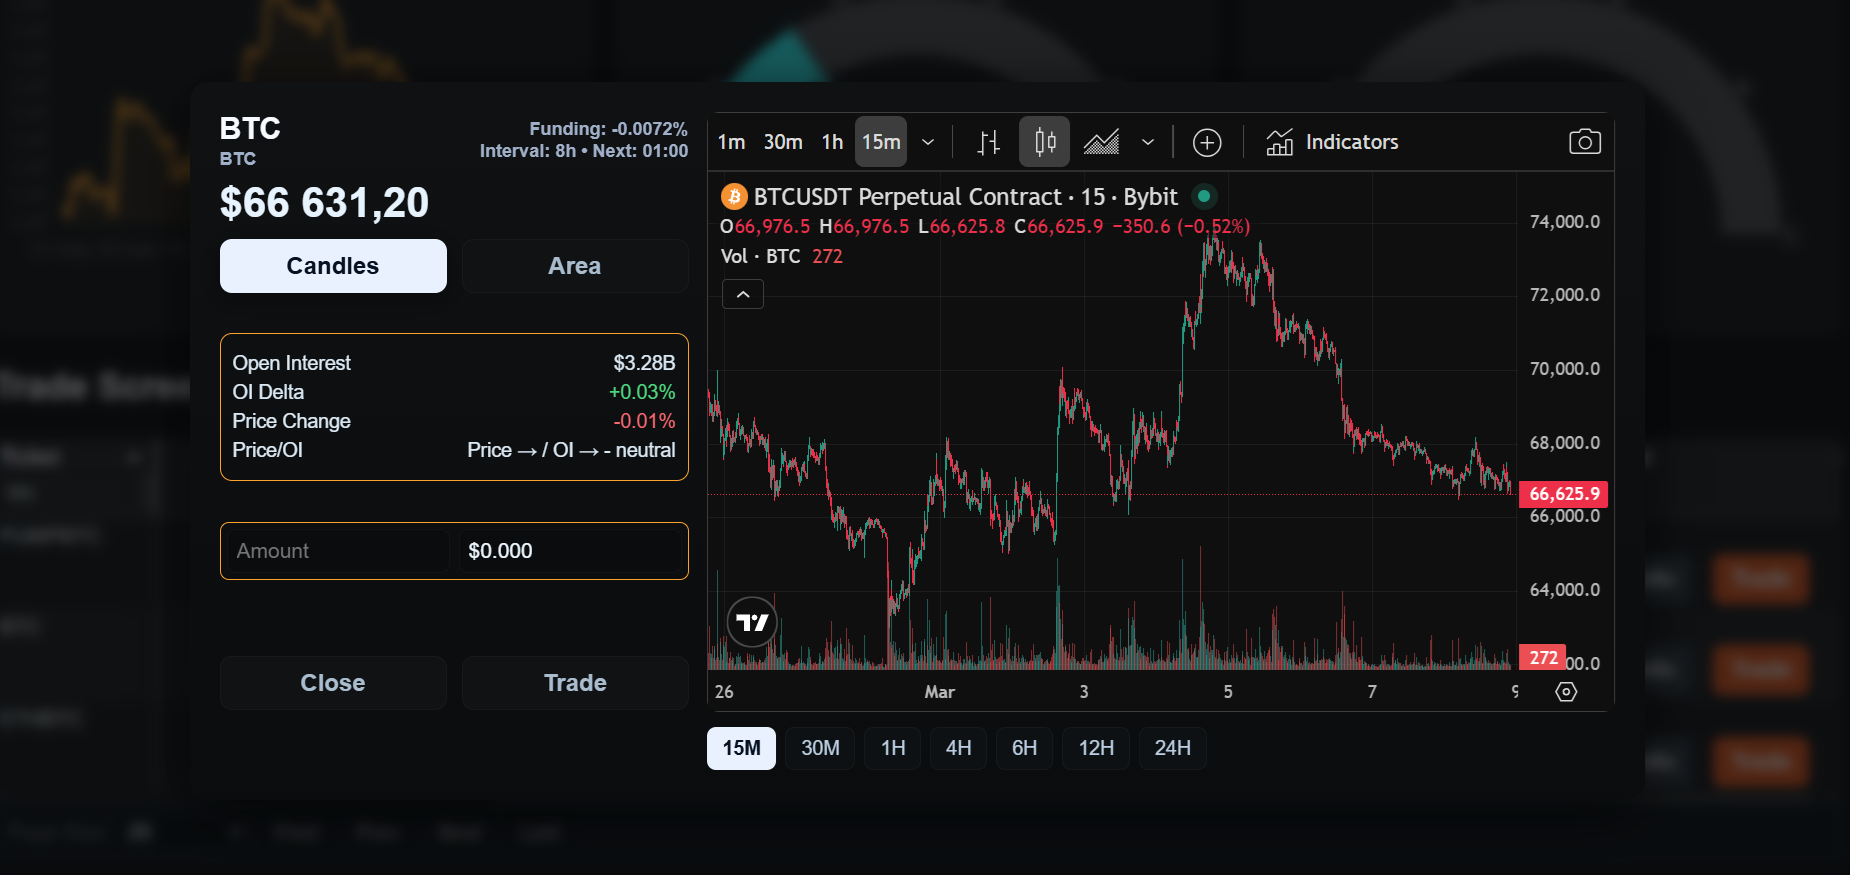
The Info window includes:
Coin ticker, symbol, and current price
Funding — funding rate, funding interval, and the time of the next funding event
TradingView chart with the following timeframes: 15M, 30M, 1H, 4H, 6H, 12H, 24H
Chart display toggle — Candles / Area
Statistics block — Open Interest, OI Delta, Price Change, Price/OI
Mini calculator: Amount — shows the value in USD based on the current price
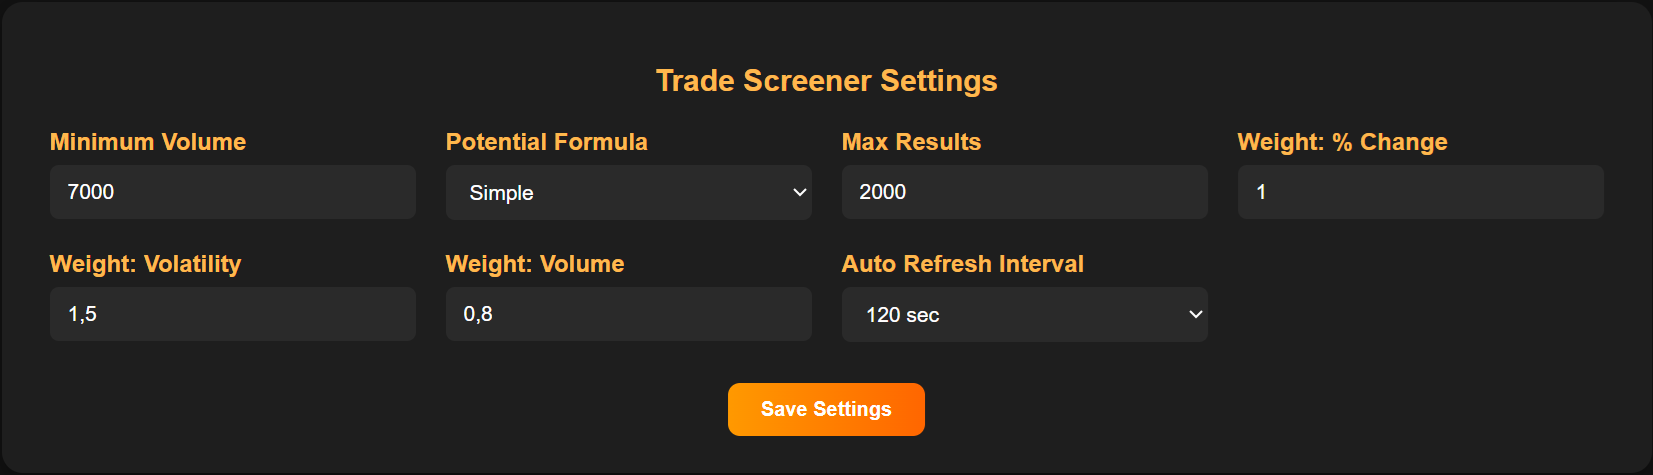
Below, we will review the global settings used to configure the Trade Screener:
The Range Position (24h) column shows not only where the price is currently located within the daily range, but also provides directional context.
Buy % / Sell % — the relative position of the current price between the 24-hour Low and High.
If the price is closer to the Low, the Buy % is usually higher; if it is closer to the High, the Sell % is usually higher.
Bias — the resulting directional lean: Buy bias, Sell bias, or Neutral.
Confidence — the strength of that bias expressed as a percentage. The higher the percentage, the more pronounced the signal.
What is taken into account when calculating Bias / Confidence:
The price position within the 24-hour range — this is the foundation of the model.
The relationship between price change and open interest — this provides context on whether positions are flowing into or out of the market.
The strength and direction of the 24-hour trend
How to interpret it in practice:
Buy bias + high Confidence — the instrument is more often considered a candidate for a Long position, subject to additional confirmation.
Sell bias + high Confidence — the instrument is more often considered a candidate for a Short position.
Neutral or low Confidence — a borderline or unclear zone, usually better treated as lower priority.